UAS endurance is the time an unmanned aircraft can remain airborne under stated conditions. Weight changes the power needed to fly, speed changes both power demand and distance covered, and weather changes the air flowing over the aircraft and the energy its battery can deliver. These effects interact: a heavier aircraft returning into wind on a cold battery cannot be assessed by subtracting three generic percentages from a quoted flight time.
The calculations below focus on battery-powered multirotors and fixed-wing UAS. Begin with usable energy divided by average electrical power, then account separately for outbound flight, useful work, return, landing, and reserve. Fuel, solar, and tethered systems require different energy-supply models.
On This Page
- Endurance, range, and useful mission time
- The energy path through the aircraft
- Why weight costs more than carrying capacity
- Why the slowest flight is not always the longest
- Wind changes the return calculation
- Temperature and air density act on different parts
- Build a mission energy budget
- Failures that a flight-time estimate can hide
- Match the endurance evidence to the task
Endurance, range, and useful mission time
Endurance measures time aloft. Range measures distance travelled. Time on station is the portion available at the work location after transit and recovery requirements are accounted for. A maximum flight-time number therefore does not establish how long a sensor can observe a site several kilometres away.
At constant conditions, the basic electrical calculation is:
Flight time in hours = usable battery energy in watt-hours / average battery power in watts.
Watt-hours describe energy; watts describe how quickly it is consumed. A battery's ampere-hour rating alone is insufficient for comparing packs at different voltages. Nor is its nominal energy necessarily the energy available before the aircraft reaches its operating limit.
Distance adds another variable: groundspeed. NASA's range explanation relates distance to speed and time and distinguishes ideal depletion from operation with a reserve. Fuel-powered aircraft also become lighter as fuel burns. A battery-powered aircraft carries essentially the same battery mass throughout the flight, so a fuel-based range equation cannot simply be reused by substituting battery mass.
The energy path through the aircraft
In a small electric UAS, battery power passes through distribution wiring to propulsion and to regulated supplies for flight electronics and payloads. Electronic speed controllers drive the motors; the motor-propeller combinations turn electrical input into thrust. Losses along this path mean battery power and useful aerodynamic power are different quantities.
The PX4 v1.16 power-system documentation describes separate supplies for controllers, motors, servos, and peripherals, with battery information available through power modules or supported telemetry. For an endurance assessment, identify where voltage and current are measured. A sensor upstream of every aircraft load captures a different total from one measuring propulsion alone.
Trace three interfaces when integrating a payload:
- Mechanical: installed mass, mounting position, and exposed shape.
- Electrical: operating voltage, continuous draw, peak draw, and conversion losses.
- Information: which measurements reach the flight controller and ground display, and whether the endurance estimate includes the new load.
A powered sensor can affect endurance through both its electrical demand and the effort of carrying it. A self-powered payload removes its draw from the main supply but still contributes mass and drag.
Why weight costs more than carrying capacity
A multirotor hovering out of ground effect must generate enough thrust to support its weight. The momentum-theory hover model in Bauersfeld and Scaramuzza's multicopter study gives a useful relationship: with rotor area, air density, and efficiency held constant, hover power scales with weight to the power of 1.5.
For example, 20% more total weight gives a model power ratio of 1.2^1.5, about 1.31. Unchanged usable energy then gives a time ratio of 1/1.31, about 0.76. This illustrative sensitivity excludes changes in efficiency and battery behaviour; it is not a measured payload penalty.
Adding battery capacity also adds weight. Compare complete installations, including mounting hardware, rather than scaling flight time directly with capacity.
For fixed-wing aircraft, additional weight changes the lift requirement and power curve. Traub's battery-aircraft analysis connects aircraft weight, drag, propulsion losses, and battery discharge behaviour. A payload allowance establishes a carrying limit; it does not specify the flight time at that load.
Why the slowest flight is not always the longest
Hover is not necessarily the minimum-power condition. Bauersfeld and Scaramuzza find lower power in modest forward flight and different speeds for maximum endurance and range. Their results are not universal speed settings.
For a conventional fixed-wing aircraft, flying too slowly increases the power associated with supporting lift, while higher speed increases the power spent overcoming other drag. Under simplified constant-efficiency assumptions, maximum endurance corresponds to minimum power; maximum range corresponds to minimum energy per distance. Actual battery and propulsion behaviour can shift those optima. Traub's analysis derives separate range and endurance conditions rather than a single economical speed. A mathematical optimum is usable only if it satisfies the aircraft's stall margin and operating limits.
The useful comparison is therefore a power-versus-airspeed curve for the installed configuration, within its permitted operating envelope. Ask whether an advertised endurance figure represents hover, straight flight, or a complete mission.
NASA's multicopter wind-tunnel programme measured electrical power alongside forces and moments while varying attitude, rotor speed, and wind speed. These measurements illustrate why a static thrust figure alone cannot describe flight energy consumption.
Wind changes the return calculation
Airspeed is motion relative to the air. Groundspeed is motion over the ground. For a directly aligned wind, groundspeed equals airspeed plus a tailwind or minus a headwind. With crosswind, use the velocity vectors rather than subtracting the full wind speed from forward speed. Godbole and colleagues' steady-wind research models relative airflow and shows why reachable distance depends on wind direction as well as magnitude.
A steady headwind does not automatically increase a fixed-wing aircraft's power demand if it maintains the same airspeed and flight condition. It can instead increase the time needed to cover the ground. Holding a specified groundspeed requires different airspeeds in opposing wind directions, so the power requirement must also be reconsidered.
An outbound tailwind does not cancel the headwind home
Consider an illustrative straight route: 2 km outward and 2 km back, at a constant true airspeed of 12 m/s. Assume a steady 4 m/s wind aligned with the route, unchanged altitude, and no turns or acceleration time.
| Leg | Groundspeed | Time for 2 km |
|---|---|---|
| Outbound with tailwind | 12 + 4 = 16 m/s | 125 seconds |
| Return into headwind | 12 - 4 = 8 m/s | 250 seconds |
| Each leg in still air | 12 m/s | About 167 seconds |
The windy round trip takes 375 seconds, versus about 333 seconds in still air: 12.5% longer. These are editorial calculations using distance divided by speed, not flight-test results. If electrical power were equal on both legs, transit energy would also rise 12.5%; changes in power or wind would require another calculation.
The return leg consumes more time than the outbound leg saves. A return decision based only on elapsed time or distance already travelled misses this asymmetry. Near a headwind equal to the available along-track airspeed, forward ground progress approaches zero even while the aircraft continues consuming energy.
Temperature and air density act on different parts
Cold primarily threatens the battery side of an electric endurance estimate. DJI's winter guidance describes increased battery internal resistance, reduced discharge capability, and greater voltage drop in cold conditions. Its product-specific temperature instructions are not settings for every aircraft. Use the applicable battery manual and the pack's actual temperature, rather than ambient temperature alone.
This interacts with weight: a cold pack asked to supply a high propulsion load may reach a voltage or power limit while the display still shows remaining charge. A pack's ability to deliver a short high-power climb is a different question from its total stored energy.
Air density acts on aerodynamic performance. The National Weather Service's density-altitude explanation identifies pressure, temperature, and humidity as contributing variables. Hot, high-elevation conditions generally mean thinner air. Electric propulsion avoids the combustion-air penalty of an unboosted piston engine, but its propellers and wings still depend on air density.
Weather must therefore be represented in both the propulsion model and the battery assumptions. Do not apply a general-aviation engine correction directly to an electric motor, or assume cold dense air compensates for a cold battery. Steady-wind calculations also omit gust-driven manoeuvres. Precipitation and icing require a separate aircraft operating-envelope decision; extra energy does not establish permission or capability to fly in them.
Build a mission energy budget
Use a separate power and duration estimate for each phase. Define usable energy at the battery terminals so conversion losses are included in the measured or modelled load. Keep the reserve separate from planned consumption.
Available task energy = usable energy - reserve - takeoff and climb energy - outbound energy - return energy - landing energy.
The following example uses invented engineering inputs solely to demonstrate the arithmetic. They are not aircraft specifications, a recommended reserve, or a flight plan. Assume 240 Wh is available before the applicable discharge limit, then withhold 48 Wh as reserve. That leaves 192 Wh for the planned flight.
| Phase | Assumed total electrical power | Duration | Energy |
|---|---|---|---|
| Takeoff and climb | 900 W | 1 minute | 15 Wh |
| Outbound transit | 600 W | 4 minutes | 40 Wh |
| Work at the site | 500 W | Calculated below | 82 Wh available |
| Return transit | 600 W | 5 minutes | 50 Wh |
| Approach and landing | 300 W | 1 minute | 5 Wh |
For each fixed-duration phase, energy in Wh = power in W × minutes / 60. Transit and recovery use 110 Wh, leaving 82 Wh for the task. Task time = 82/500 × 60, approximately 9.8 minutes. Total planned airborne time is about 20.8 minutes, with the 48 Wh reserve still excluded from consumption.
Now assume the same configuration requires two more return minutes at 600 W. That consumes another 20 Wh and cuts task time by 2.4 minutes. A colder-battery case must also revise usable energy; a heavier-payload case must revise phase power. Changing several inputs together is more informative than applying separate percentage deductions to a maximum flight-time claim.
Never subtract the reserve twice. If a supplied usable-energy figure already excludes it, state that boundary and omit the second deduction. Also keep reserve energy distinct from predicted minutes: its duration depends on the power needed during recovery.
Failures that a flight-time estimate can hide
The PX4 v1.16 battery-estimation guide distinguishes raw voltage estimates from load compensation and current integration. Voltage falls under load, and current-based estimates depend on accurate measurements. A displayed percentage is an estimate of battery state, not a guarantee of remaining mission time.
| Failure or mismatch | Why the estimate becomes misleading | Evidence to request |
|---|---|---|
| Current sensor misses a payload supply | Recorded consumption omits part of the load | Measurement location and complete power-path diagram |
| Voltage or current calibration is wrong | Remaining-charge calculations start from incorrect inputs | Calibration record and comparison with independent measurement |
| Cold pack cannot sustain peak demand | Stored energy remains but required power is unavailable | Battery limits and loaded voltage at the relevant temperature |
| Return settings add climb or loiter | Recovery consumes more than the transit-only budget | Actual return altitude, route, loiter, and landing sequence |
Source basis: PX4's power, battery, and failsafe documentation, plus DJI's cold-weather guidance. The evidence requests are engineering synthesis, not a universal emergency procedure.
PX4 v1.16 separately documents low-battery responses and a remaining-flight-time trigger for safe return. The response is configurable. For any system, establish which estimate triggers recovery and what the recovery actually does. A return command cannot create the energy or airspeed needed to get home.
Match the endurance evidence to the task
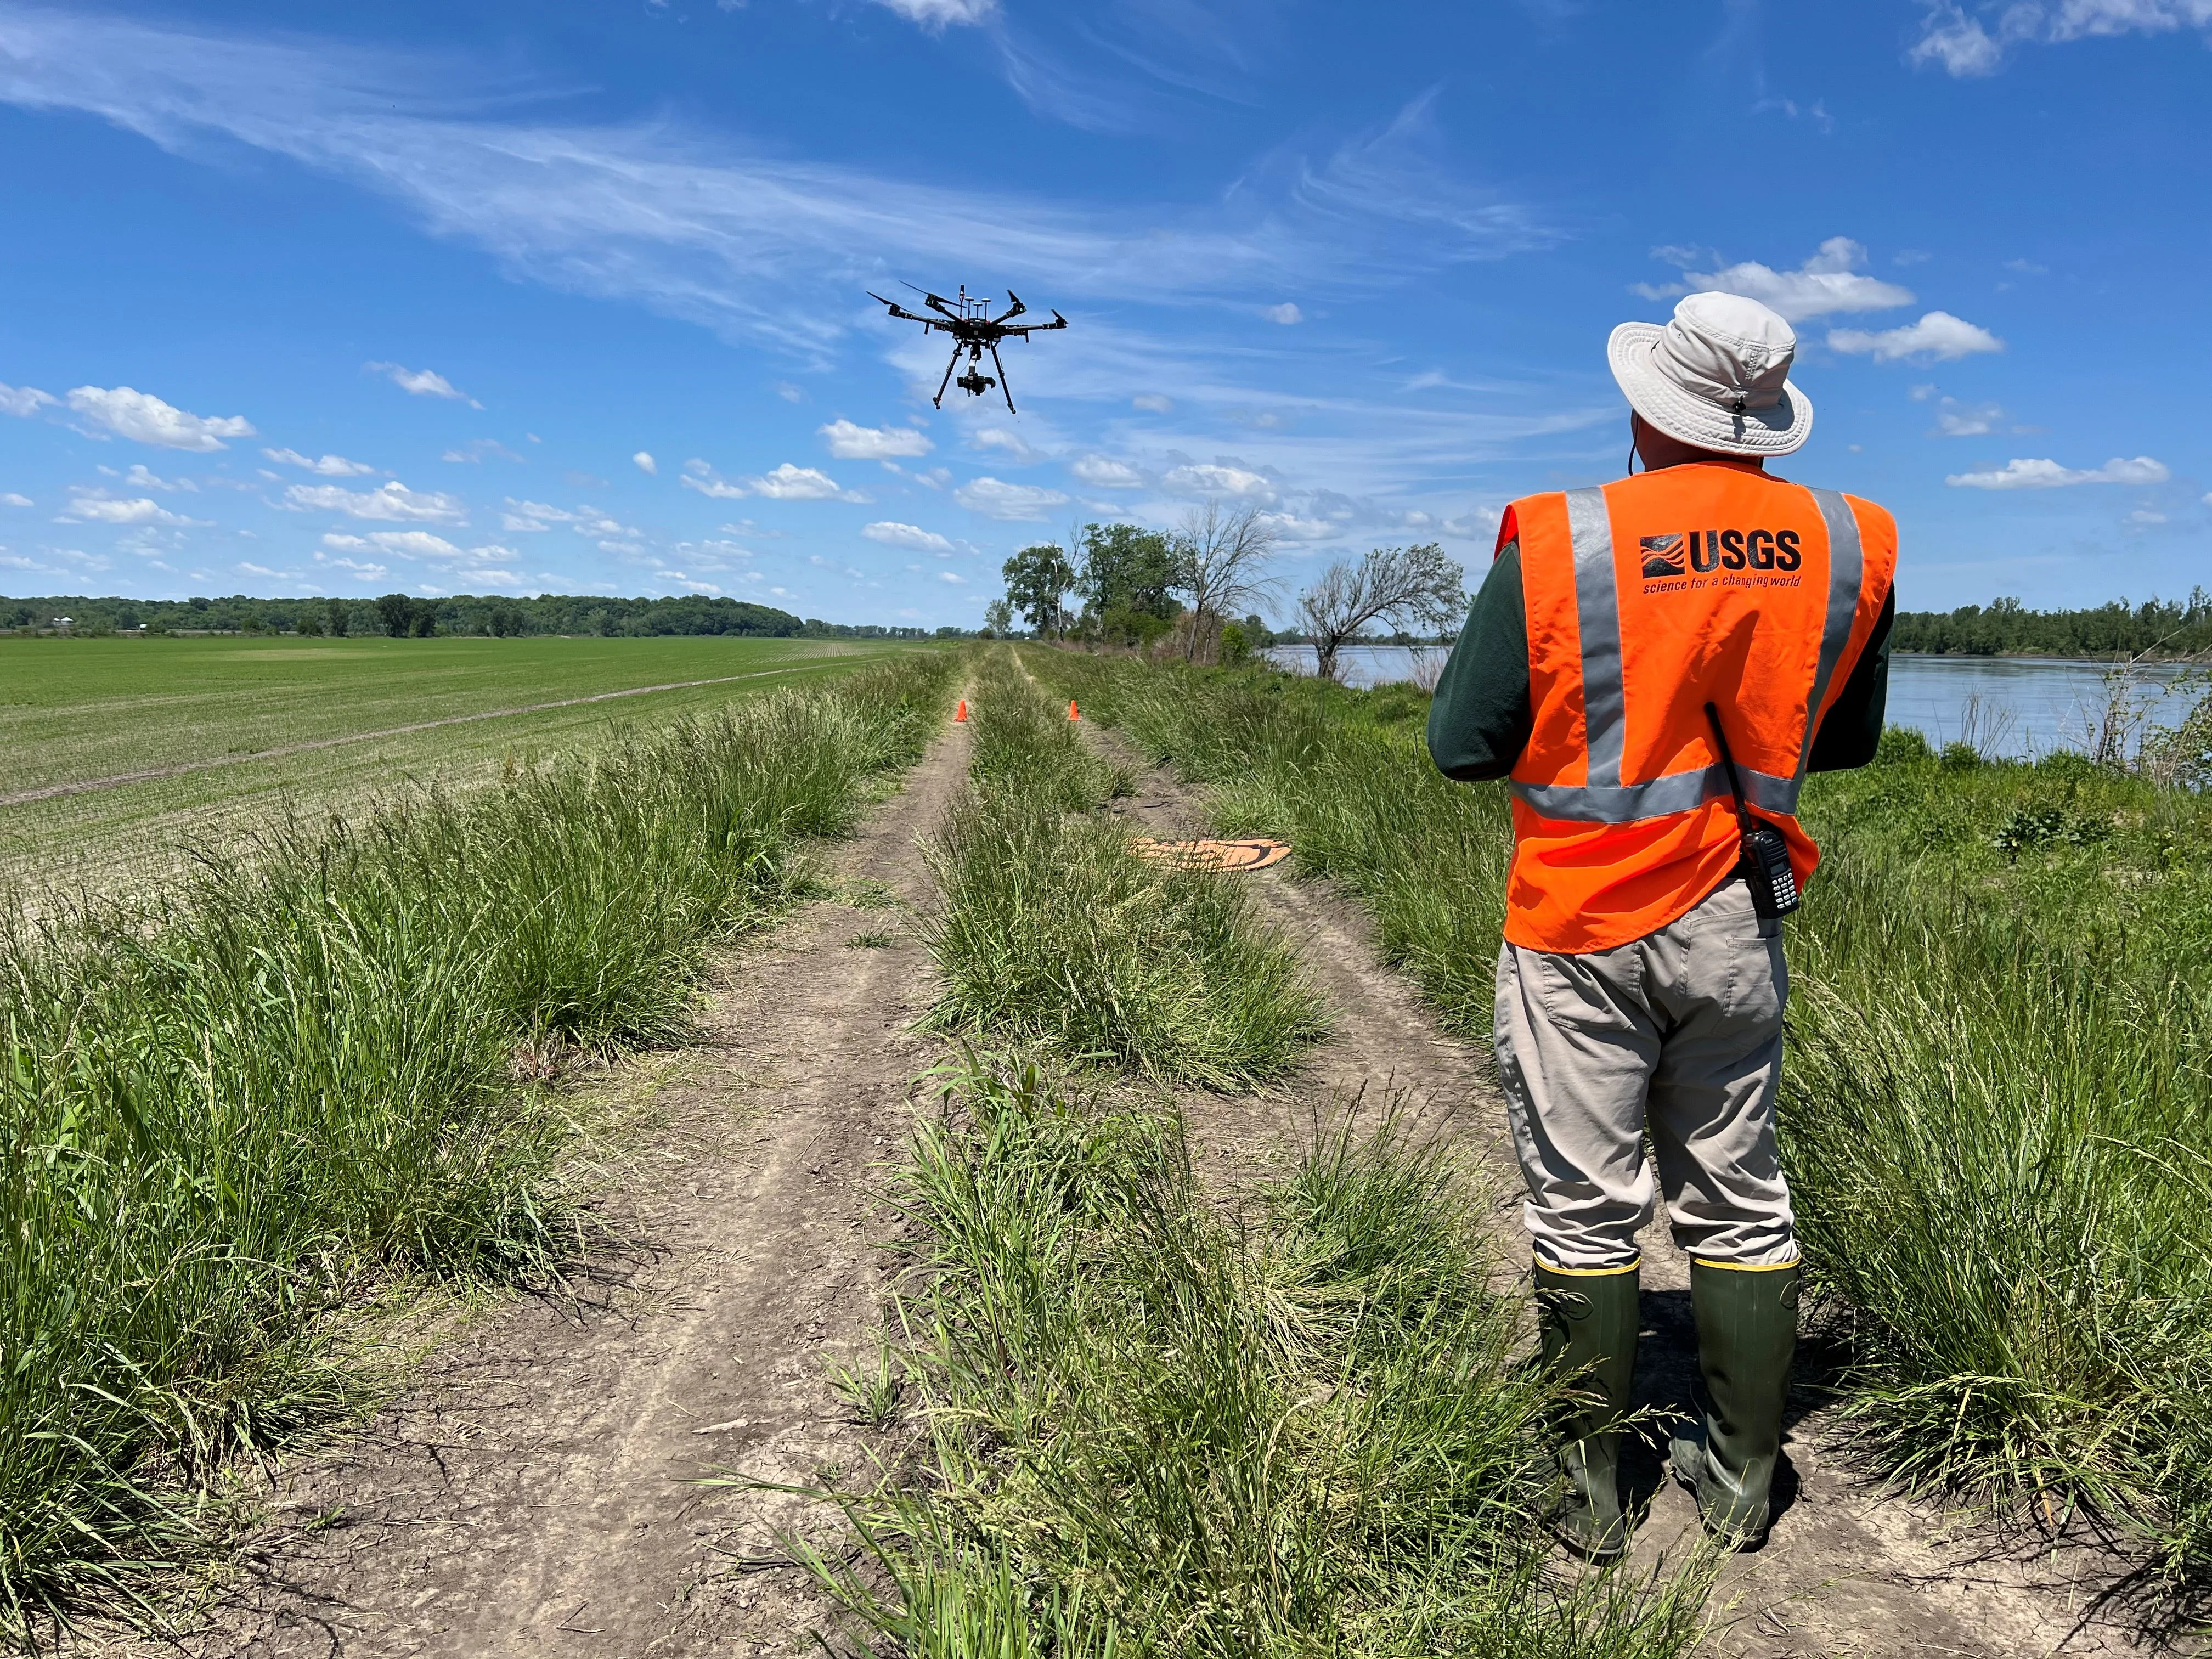
The USGS aircraft in the featured photograph carried a digital camera for elevation modelling used in erosion and hydraulic analysis. That is a concrete payload-and-output requirement against which useful flight time can be assessed.
For close inspection requiring stationary observation, compare hover endurance with the required sensor fitted and operating. For mapping, compare useful coverage at a suitable survey speed, including turns and transit. For a vertical-takeoff-and-landing fixed-wing aircraft, include both vertical phases and transitions in the energy budget.
These mission distinctions follow the broad airframe tradeoffs in PX4's vehicle overview: multicopters offer hover capability, conventional fixed-wing aircraft suit wider-area flight, and hybrid aircraft combine vertical operation with wing-borne cruise. They do not establish a performance ranking between unmatched models.
Request endurance evidence that states total takeoff mass, payload configuration and draw, battery condition and temperature, flight profile, airspeed, wind, density altitude, landing endpoint, and reserve treatment. Then compare predicted phase consumption with representative flight records for that configuration. The number that matters is useful mission time with recovery accounted for, under the conditions in which the work must be done.
Sources
-
NASA Glenn: Range, Constant Velocity. Agency teaching material on distance, time, fuel consumption, and reserve assumptions.
-
PX4 v1.16: Power Systems. Project documentation on supply paths and battery telemetry.
-
Bauersfeld and Scaramuzza: Range, Endurance, and Optimal Speed Estimates for Multicopters. Research paper, accepted in 2022, on coupled aerodynamic, motor, and battery models.
-
Traub: Range and Endurance Estimates for Battery-Powered Aircraft. Author-posted 2011 Journal of Aircraft paper on electric fixed-wing performance.
-
NASA Ames: Multicopter UAS Performance Test. Agency account and photographs of wind-tunnel testing with electrical-power measurements.
-
Godbole and colleagues: Multicopter Range and Endurance Under Steady Wind. Peer-reviewed 2019 modelling study of wind-dependent performance.
-
DJI Enterprise: Winter Drone Guidelines. Manufacturer guidance on cold-battery behaviour and weather limitations.
-
National Weather Service: High Density Altitude. Agency explanation of air density and aircraft performance.
-
PX4 v1.16: Battery Estimation Tuning. Project documentation on voltage, current measurement, and charge estimates.
-
PX4 v1.16: Safety Configuration. Version-specific documentation on battery triggers and recovery settings.
-
PX4 v1.16: Basic Concepts. Project overview of airframe types and mission tradeoffs.
-
USGS: Unmanned Aerial System. Agency photograph and description of a camera-equipped aircraft used for elevation modelling; explicitly public domain.
Last checked: September 6, 2026.