Underwater sonar types serve different jobs: side-scan and synthetic aperture sonar produce seabed imagery; multibeam echo sounders measure seafloor shape; forward-looking sonar observes the space ahead; and sub-bottom profilers reveal sediment layers. An autonomous underwater vehicle (AUV) may carry several of these alongside navigation sensors. The useful choice starts with the required measurement, rather than the sharpest example image.
An acoustic image, a depth map, and a velocity estimate are different outputs. That distinction determines what the vehicle must carry, how its software uses the data, and which failures can compromise a mission.
On This Page
- Match the sonar to the measurement
- How echoes become useful data
- Side-scan, multibeam, and synthetic aperture sonar
- Forward-looking sonar and sub-bottom profiling
- Interfaces that make a sonar part of the vehicle
- Performance tradeoffs and failure symptoms
- Choose a package around the mission
Match the sonar to the measurement
These categories overlap. “Multibeam” describes the formation of multiple receiving beams, while “forward-looking” describes viewing direction. A forward-looking imaging sonar can therefore be multibeam without producing a survey-grade bathymetric surface.
| Sonar or acoustic sensor | Principal output | Representative use | Limitation to resolve |
|---|---|---|---|
| Single-beam echo sounder or acoustic altimeter | Distance along a beam | Depth sounding or vehicle clearance | A single footprint does not map a wide corridor |
| Conventional side-scan sonar | Echo-intensity image across a strip of seabed | Wreck search and seabed texture mapping | Ordinary imagery does not directly supply depth |
| Multibeam echo sounder, or MBES | Bathymetric soundings across a swath, often with backscatter | Terrain and infrastructure survey | Position, attitude, and sound-speed errors affect the mapped result |
| Synthetic aperture sonar, or SAS | Fine seabed imagery reconstructed from successive pings | Detailed object and seabed surveys | Motion estimation and coherent processing are central dependencies |
| Forward-looking imaging sonar | Acoustic view ahead of the vehicle | Inspection approach and obstacle sensing | A two-dimensional image may leave target elevation unresolved |
| Sub-bottom profiler | Acoustic section through sediment | Buried layers, faults, and geological structure | Penetration and interpretation depend on the subsurface |
| Doppler velocity log, or DVL | Velocity relative to the bottom or water | Navigation aiding | A velocity measurement is neither a scene image nor an absolute position fix |
The table synthesizes the NOAA, MBARI, research, and manufacturer documentation discussed below. The mission matches are editorial interpretations of those measurement capabilities, not interchangeable equipment specifications.
How echoes become useful data
The active sonars discussed here transmit sound and process returning echoes. Their basic signal chain is a transducer, transmit and receive electronics, signal processing, and a data consumer such as a survey logger or perception system. The same observation can be recorded for later mapping while also informing a vehicle function.
For a simple straight sound path, range = sound speed × round-trip travel time ÷ 2. The division by two accounts for the outward and return journeys. This is the ranging principle described in the Oculus M-Series manual, revision 3.
As an illustrative calculation, assume constant sound speed of 1,500 meters per second and an echo delay of 0.10 seconds. The resulting slant range is 75 meters. It is distance along the sound path, not automatically vertical depth. The example ignores refraction, vehicle motion, and processing delays; it is not an accuracy specification.
Mapping needs more than elapsed time. Beam direction supplies geometry, echo strength supplies backscatter information, and navigation places the observation in a reference frame. Water properties change sound propagation. NOAA's hydrographic equipment overview explains why sound-speed profiling accompanies sonar surveying. On an AUV, a depth sensor measures the vehicle's depth while a downward-looking sonar measures its relationship to the seabed. Those values answer different questions.
Side-scan, multibeam, and synthetic aperture sonar
Side-scan emphasizes reflectivity and shadows
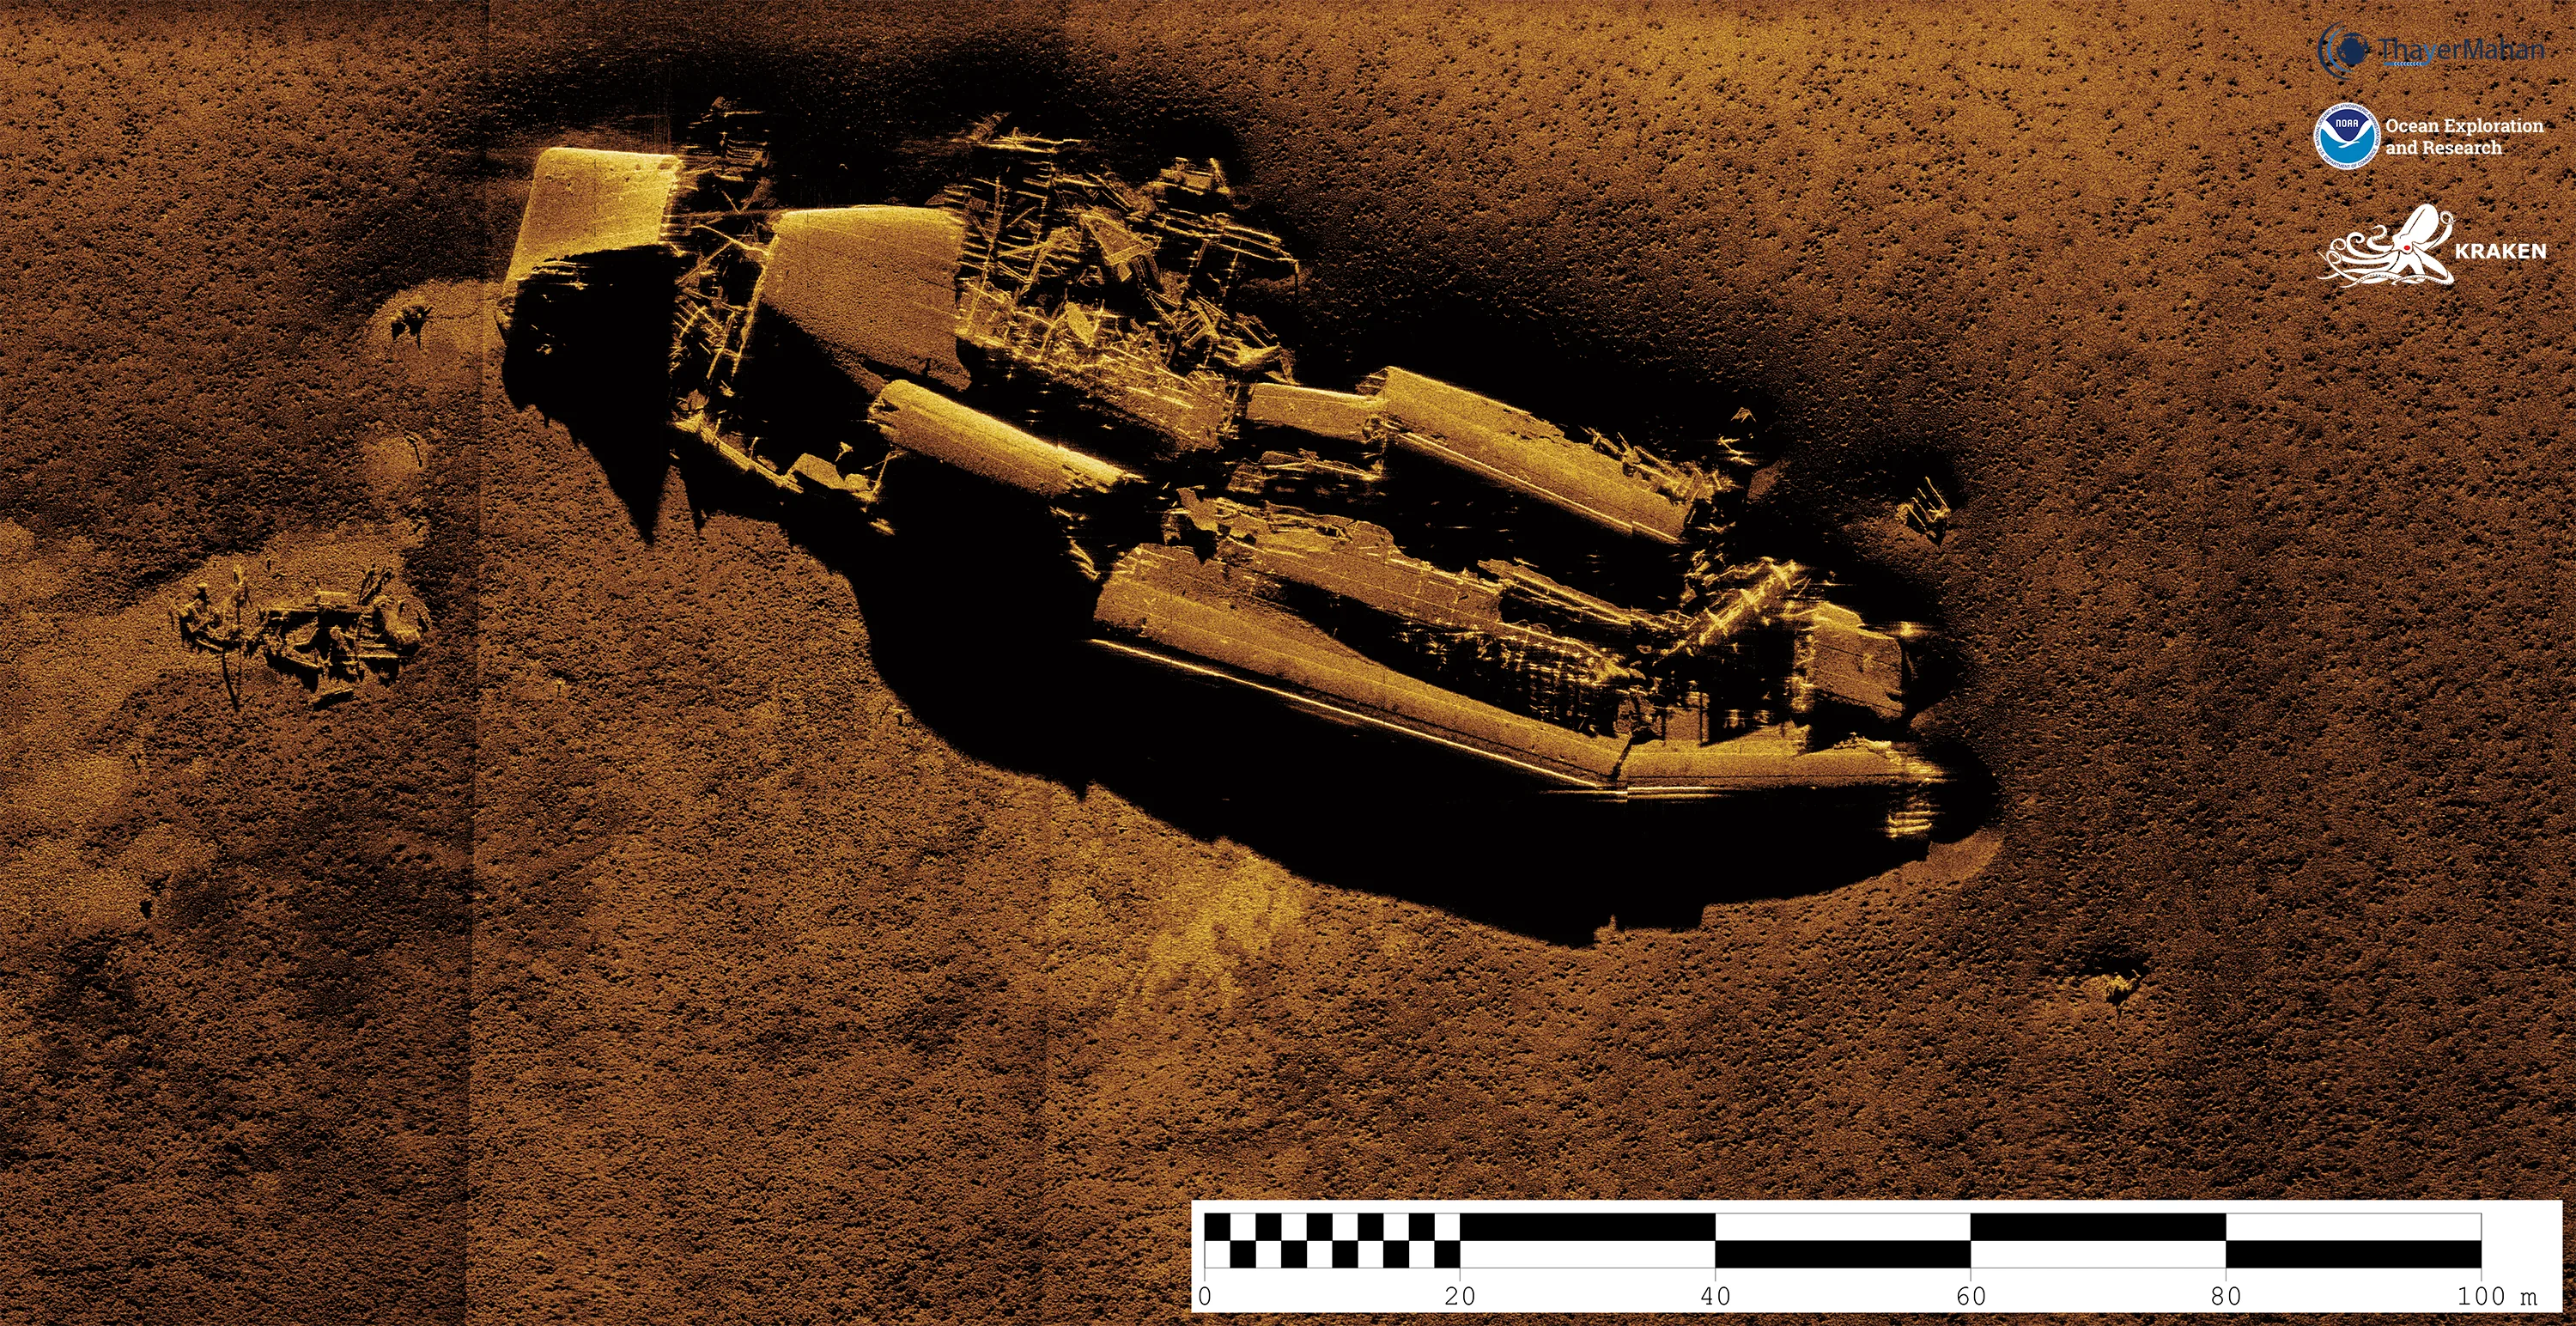
Side-scan sonar builds a strip image as the platform advances. Strong and weak echoes, together with acoustic shadows, help reveal objects and changes in seabed character. Display palettes differ, so “bright” and “dark” should not be treated as universal material labels.
NOAA describes side-scan use for wrecks and habitat mapping, with higher-frequency operation trading coverage for detail. Ordinary side-scan does not directly measure bathymetry. An image may show an obstruction clearly while leaving its least depth unanswered. Ask whether a proposed system includes a separate depth-measuring channel or a specifically documented bathymetric capability.
Multibeam emphasizes measured geometry
An MBES produces soundings across a fan-shaped swath. Many systems also retain backscatter, allowing terrain shape and reflectivity to be interpreted together. NOAA documents this pairing in its hydrographic equipment overview.
For vehicle integration, treat the sonar head and the navigation solution as one measurement chain. Fine beam spacing cannot correct a wrongly oriented or wrongly positioned swath. Review the completed surface and its uncertainty, not just the number of beams in a specification sheet.
SAS uses vehicle motion to form a longer aperture
SAS combines echoes from successive vehicle positions coherently, preserving their phase relationships to form a much longer effective receiving array. This improves detail along the direction of travel without requiring a physical array of equivalent length. Tony Lyons's NOAA-hosted technical explanation distinguishes this along-track benefit from range resolution, which depends on signal bandwidth.
That gain requires accurate knowledge of motion between observations. Caporale and Petillot's SAS micronavigation research describes combining inertial sensing with signal processing to estimate motion at subwavelength scales. Poor motion compensation can undermine image focusing even when the vehicle's broad mission track appears reasonable.
SAS imagery also should not be confused with bathymetry. Some systems combine the two: FFI's 2007 SENSOTEK report describes an interferometric SAS installed on a HUGIN research AUV, with receiver arrays enabling seafloor mapping alongside imagery. That establishes an architecture, not a universal capability of every SAS.
Forward-looking sonar and sub-bottom profiling
Forward-looking imaging sonar is useful when a remotely operated vehicle (ROV) or AUV needs acoustic observations ahead. However, observation and avoidance are separate functions: software must interpret returns, account for uncertainty, and select a feasible vehicle response.
Two-dimensional imaging leaves an elevation ambiguity: range and horizontal bearing do not uniquely locate a target in three dimensions. Research on combining orthogonal imaging sonars addresses that missing information. For an integration review, ask how the vehicle resolves vertical clearance and what it does when a return cannot be located sufficiently well. A clear-looking sector display alone does not establish three-dimensional obstacle clearance.
A sub-bottom profiler looks for interfaces beneath the seabed. Some transmitted energy penetrates the bottom and returns from deeper layers, producing a section through the subsurface. The Discovery of Sound in the Sea explanation describes this reflection principle.
This is a different question from identifying an exposed object. A cable-route investigation may need both seabed geometry and information about the sediment below it. Acoustic layering still requires geological interpretation; it does not by itself establish soil strength or excavation performance.
Interfaces that make a sonar part of the vehicle
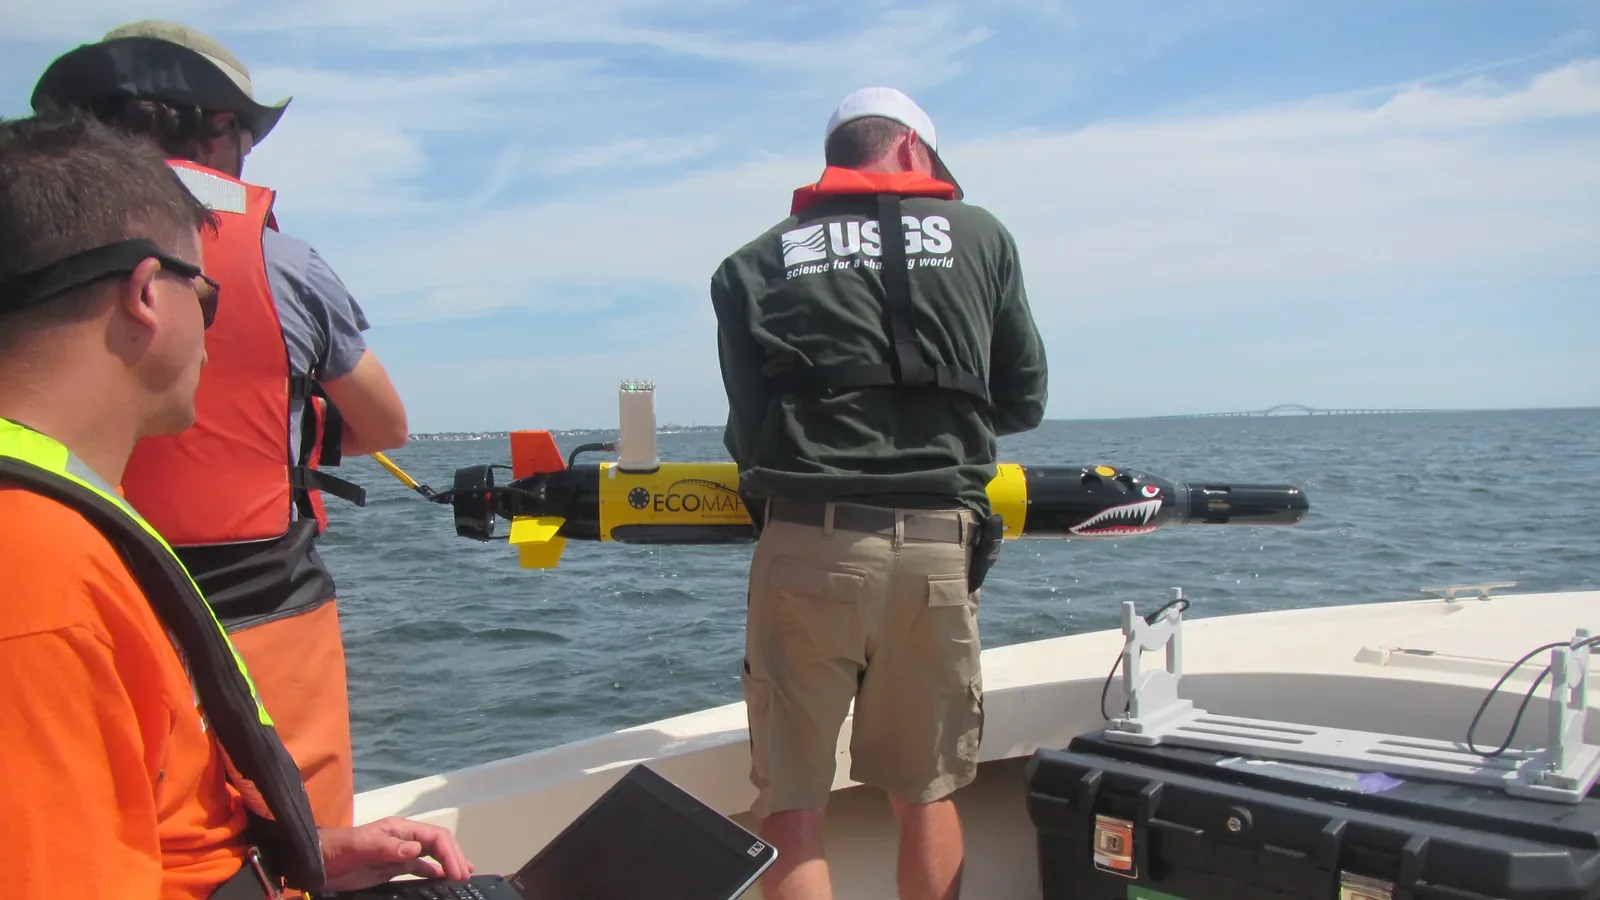
MBARI's Seafloor Mapping AUV demonstrates why a package contains complementary sensors: multibeam, side-scan, and sub-bottom profiling operate with inertial navigation, a DVL, depth sensing, and sound-speed information. The institution describes these as distinct mapping and navigation functions.
For a proposed integration, request the following interface information. These questions translate the documented dependencies into an engineering review:
- Power and installation: connector pinout, supply limits, operating load, mounting orientation, and an unobstructed acoustic field of view.
- Measurement geometry: sensor coordinate axes, mounting angles, and offsets from the vehicle's navigation reference point.
- Time: when each measurement was made, how clocks agree, and whether a timestamp represents acquisition or later delivery.
- Data: raw returns or processed products, units, quality flags, packet format, logging capacity, and replay support.
- Control: supported range and mode commands, triggering behavior, and the response to missing or invalid observations.
A physical connection is only the first part of interoperability. The Oculus manual, for example, specifies Ethernet wiring; the manufacturer's current support page separately warns that ViewPoint V2 logs are not directly backward-compatible with ViewPoint V1 or SDK V1, although V1 export is available. An Ethernet port does not guarantee that an existing recorder or analysis tool can read the data.
The DVL needs similarly explicit treatment. Nortek's 2017 operations manual distinguishes bottom tracking from water tracking and documents coordinate systems, data formats, and triggering. Water-relative velocity must not silently substitute for bottom-relative velocity in navigation: moving water changes the reference.
Performance tradeoffs and failure symptoms
Higher frequency can improve detail, but increasing acoustic attenuation constrains usable distance. An AUV can bring a sonar closer to the seabed in deep water, as MBARI explains, making high-frequency mapping practical without demanding that the signal traverse the full water column. Vehicle depth rating and sonar measurement range are separate limits.
Survey altitude, speed, line spacing, and processing must be considered together. A narrower useful swath may require more survey lines; a sharp image can still be poorly located; a recorded dataset may be useful after processing while being unsuitable for immediate vehicle decisions. These are mission-planning consequences, not a single numerical ranking of sonar types.
The following checks are editorial diagnostic starting points based on the cited manuals and research. A symptom can have more than one cause.
| Observed problem | Dependency to examine | Useful next check |
|---|---|---|
| Sonar display looks plausible, but target clearance is ambiguous | Vertical information absent from a 2D image | Confirm whether elevation is measured or inferred |
| SAS image loses focus | Relative motion estimate and coherent processing | Compare image quality with motion and processing diagnostics |
| DVL bottom lock becomes intermittent | Range, seabed return, bubbles, or interference | Inspect valid-beam and quality information alongside operating conditions |
| One sensor degrades when another transmits | Acoustic coexistence | Compare operation separately and together using supported trigger settings |
| Survey strips disagree in position or shape | Navigation, alignment, or sound-speed inputs | Review synchronized source data and overlapping passes |
| Sonar connects, but recorded data cannot be replayed | Software and file-format compatibility | Check recorder, firmware, SDK, and export versions |
Nortek identifies other acoustic instruments, including interfering harmonics, as possible causes of bottom-detection loss. It also lists poor bottom returns, bubbles, excessive or insufficient range, and reverberation. Frequency labels alone therefore do not prove that a sensor suite can operate together. Record quality during combined operation, and account for the sampling consequences of any alternating transmission schedule.
Choose a package around the mission
For seabed search, evaluate side-scan or SAS imagery against the objects and coverage required, then establish how detections will be located and revisited. For terrain mapping, prioritize bathymetry and the navigation and sound-speed inputs that support it. For close inspection, review forward-looking observations together with the vehicle's ability to interpret and act on them. For subsurface investigation, add profiling and geological interpretation.
Before accepting a package, ask for a representative dataset containing the final output, supporting navigation, timing, quality information, and processing settings. Then ask what capability remains when a required input fails. The strongest package is the one that produces the needed measurement under the mission's conditions, with its limitations visible to the operator and vehicle software.
Sources
- NOAA Office of Coast Survey: Hydrographic Survey Equipment. Agency explanation of multibeam, backscatter, side-scan, and sound-speed measurements.
- NOAA Ocean Exploration: Side-Scan Sonar. Operating principles, applications, and frequency tradeoffs.
- Tony Lyons: Synthetic Aperture Sonar, 2019. Researcher's explanation of aperture synthesis and directional resolution, hosted by NOAA.
- Caporale and Petillot: A New Framework for Synthetic Aperture Sonar Micronavigation, 2017. Research preprint on motion estimation; its experiment is limited to a controlled environment.
- Fusing Concurrent Orthogonal Wide-aperture Sonar Images for Dense Underwater 3D Reconstruction, 2020. Research preprint explaining elevation ambiguity and an approach to recovering three-dimensional information.
- FFI: The SENSOTEK Synthetic Aperture Sonar, 2007. Historical research-AUV example combining SAS imagery and interferometric mapping.
- Blueprint Subsea: Oculus M-Series User Manual, revision 3. Manufacturer documentation for ranging, image geometry, and physical interfaces; check the actual unit's revision.
- Blueprint Subsea: Oculus Support. Current documentation index and log-format compatibility notice.
- Discovery of Sound in the Sea: Sub-bottom Profiler. University educational explanation of reflected signals from sediment layers.
- MBARI: Seafloor Mapping AUV. Operator documentation of complementary sonars, navigation inputs, and close-bottom mapping. The page includes differing equipment descriptions; no single current hardware configuration is assumed here.
- Nortek: DVL Operations, 2017. Manufacturer manual covering measurement references, integration, and bottom-tracking failures.
Last checked: September 7, 2026.